
Zivver Insights
Understand and export Zivver Insights reporting on secure email usage.
Insights for Zivver Secure Email
Introduction
Insights for Zivver Secure Email shows how effectively you prevent email data leaks and where you can improve.
It also helps you demonstrate to senior management and external auditors that the necessary security and compliance procedures are in place.
Watch the video below.
Please click if the video isn’t loading.
What is Insights for Zivver Secure Email?
Insights provides a variety of out-of-the-box dashboards and flexible data export capabilities to help answer questions such as:
- Are employees adopting Zivver to send sensitive emails securely?
- Are users using Zivver effectively to prevent data leaks?
- Is two-factor (2FA) authentication being used effectively to send sensitive emails?
- Are email open rates affected as a result of senders encrypting emails?
- What types of sensitive information is Zivver flagging as sensitive?
- Are users using Zivver to securely send large files?
Overall, you can assess how well Zivver is protecting against email data leaks and identify areas for continuous improvement.
It helps organizations evaluate how successfully their Zivver implementation protects against email data leaks and supports ongoing improvements.
User adoption
Using Insights, you can report on the number of users sending emails via Zivver. You can also monitor trends in users and messages over time. These reports help ensure that the initial adoption rate grows and is maintained.
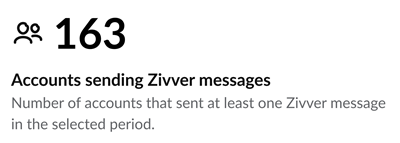
With the Accounts sending Zivver messages dashboard below, you can see how many accounts have sent Zivver messages. Based on your organization’s experience, you can quickly assess your level of protection. If you expect significantly more users to handle sensitive information, you must identify which users are not securing their emails.
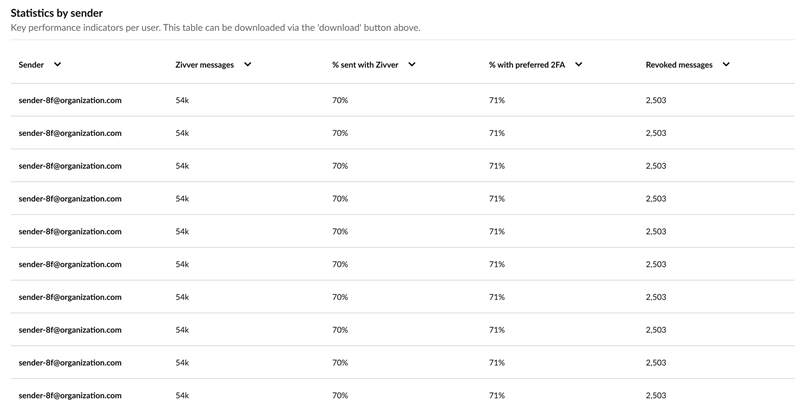
Using the Statistics by sender dashboard, you can perform further analysis on a sender-by-sender basis. Combined with a list of employees expected to handle sensitive information, this dashboard shows:
- Which users are sending Zivver messages
- The percentage of recommendations followed
- Which users potentially expose your organization to an email data leak
In addition to a one-off assessment of user adoption, you can view trends over time to monitor adoption and detect deviations from the norm. The Messages sent over time and Accounts sending messages over time graphs below clearly show that user adoption increased significantly in February as Zivver was rolled out.
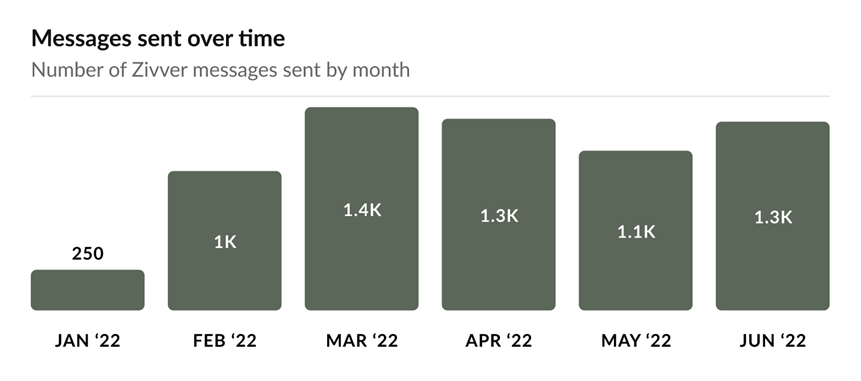
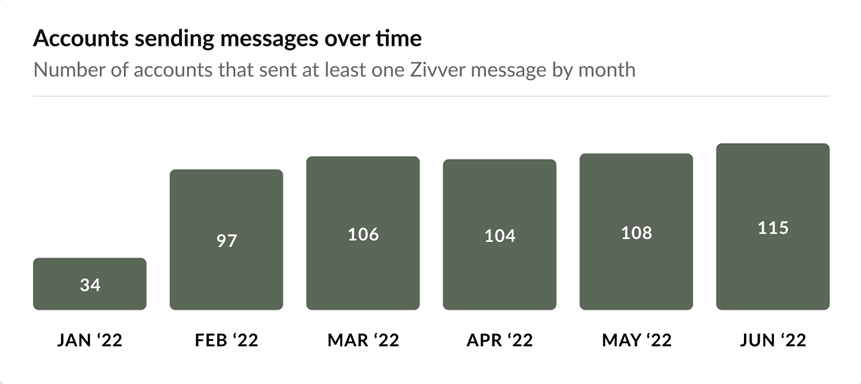
By monitoring these graphs regularly, you can detect significant changes in business activity. Report any substantial changes to the security team so they can be addressed.
For example, a sudden drop in messages or accounts could indicate that users became less attentive and may not be following recommendations to secure emails containing sensitive information.
Data leaks prevented
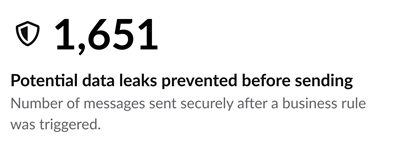
It is important to demonstrate that Insights is working by reviewing the number of potential data leaks that were prevented. Insights separates prevented data leaks into those stopped before sending and those revoked by users after sending.
Zivver recommends securing messages once a business rule is triggered. The Potential data leaks prevented before sending dashboard shows how many of these recommendations were followed. These messages could have caused a data leak if they had been sent unsecured.
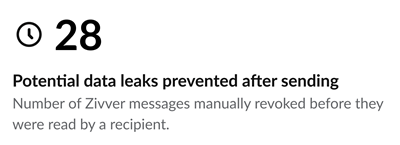
The Potential data leaks prevented after sending dashboard shows the number of emails that were revoked. The sender successfully revoked these emails manually before they were read by the recipient. If not revoked, these messages could have caused a data leak.
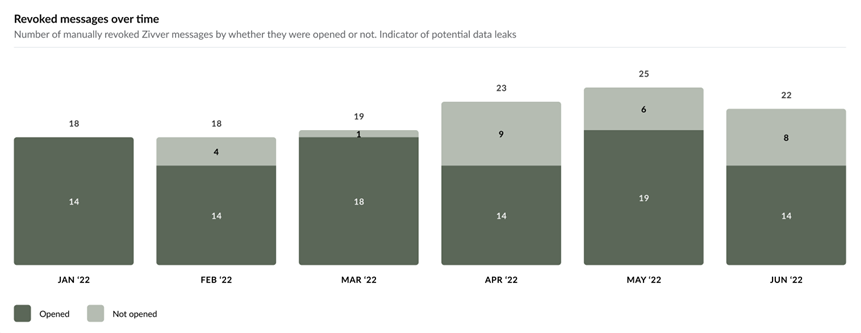
In addition, the Revoked Messages Over Time graph shows whether messages were opened by the recipient before being revoked. Messages revoked before opening prevented a potential data leak.
It is important to monitor this ratio. If the number of opened messages increases significantly, there is a higher risk of email data leaks. You should investigate and address any increase.
By combining these reports, you can explain the value of the Zivver implementation to senior managers and demonstrate to auditors that procedures are in place to prevent email data leaks.
Assessing user compliance
In addition to tracking the number of successfully prevented data leaks, you should examine which types of business rules are being triggered and the percentage of rules that users follow. The Recommendations followed by rule report shows whether users follow recommendations for sending emails securely, categorized by type (financial, fiscal, confidential, medical, employee, intellectual property, personal, SSN).
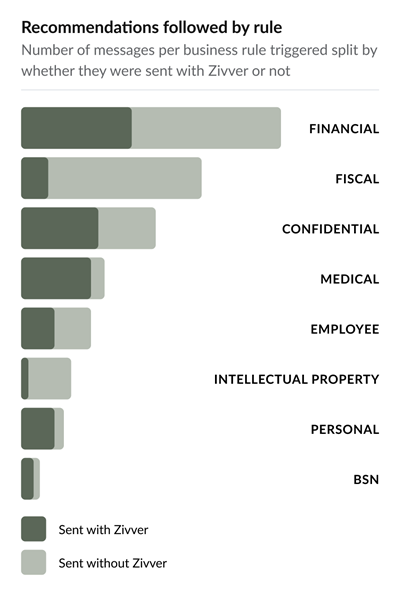
Using this graph, you can evaluate whether your organization’s protection of sensitive information is adequate. If a specific rule type shows lower adherence than expected, investigate further using tables like Statistics by sender (above) to identify which users are not following recommendations triggered by business rules. You can then provide targeted security awareness training to these users to ensure they understand the importance of protecting sensitive information and preventing email data leaks.
Measuring open rates
To determine whether encrypting emails impacts recipient open rates, use the Message open rate statistic. This metric shows the number of recipients who have opened their message at least once.
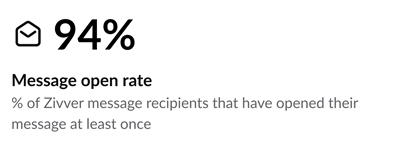
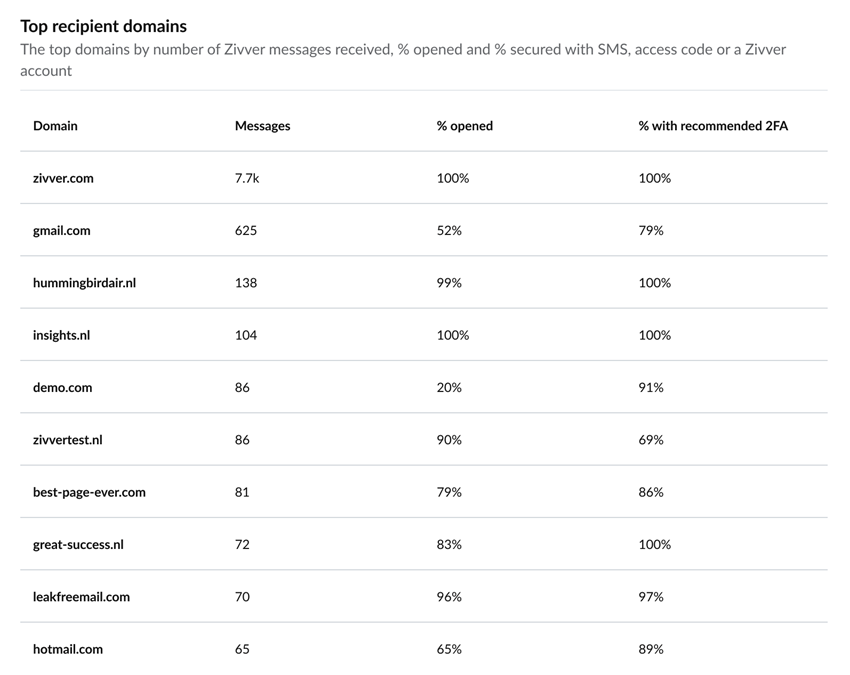
Open rates may vary depending on your organization and the recipients. However, you should investigate further if this number is lower than expected or below the best practice average of 75%. There may be a specific company that does not open the emails you send. Use the Top recipient domains table to investigate, and based on this information, implement countermeasures such as sending an explanation email ahead of the encrypted email to inform recipients what to expect.
File transfer usage
Zivver allows users to overcome the file size limitations of traditional email systems, which are often as low as 25 MB. With Zivver, senders do not need to use third-party file transfer websites to send files securely. Files of up to 5 TB can be sent directly from the email client.
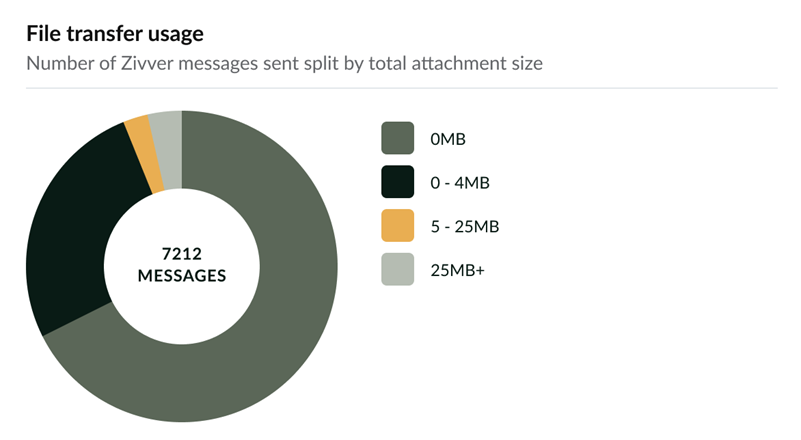
The File transfer usage dashboard shows how many attachments of each size have been sent securely via Zivver. If your organization typically sends a higher volume of large attachments, further investigation may be needed. Some users might still use third-party file transfer websites, which may not provide sufficient security and are harder to control and audit.
Integrating with third-party reporting solutions
In addition to the default out-of-the-box reports, you can export data. This exported data allows you to answer questions from senior management and auditors that are specific to your organization.
For example, using the Statistics by sender dashboard, you can analyze the sending patterns of individuals. You might also need to evaluate the adoption level or security awareness of a specific department. For instance, employees in the accounts department have access to sensitive information that must be handled securely.
Insights offers a high degree of flexibility for this purpose. You can export data for further manipulation and analysis, producing granular, team-level reports to answer questions specific to your situation by combining Insights data with your employee records.
For details about the content included in the export from the Insights dashboard, refer to Data export from Zivver Insights.
FAQ
Accessing Insights
How can access to Insights be obtained?
Access Insights directly via the Insights page, or navigate to Statistics in the Zivver administrator environment.How can granular access controls be imposed on who can see the data?
It is not possible to restrict access within the Zivver admin panel. To control access, we recommend exporting the raw data and creating custom reports in a business intelligence platform. Standard access controls can then be applied across the organization.Why does the Insights page look different from the rest of the admin settings?
We are developing an improved overall admin interface with more functionality and better navigation. The new Insights page already uses this improved interface, which is why its URL may temporarily appear as ‘app.zivver.com/beta’.Interpreting KPIs
How can the dashboards be interpreted and used?
The table below explains how to interpret Insights dashboards.| Dashboard | Description | Use | Action |
|---|---|---|---|
| Accounts sending Zivver messages | Indicator of adoption | Compare with the expected number of users sending sensitive information | Investigate which users are not sending secure emails using the Statistics by sender dashboard if numbers are lower than expected |
| Potential data leaks prevented before sending | Shows Zivver’s value in preventing sensitive data from being sent insecurely | Demonstrates how often sensitive data is sent securely, preventing potential leaks | Share with management how many potential data leaks were prevented |
| Potential data leaks prevented after sending | Shows Zivver’s value when recalling emails sent in error | Demonstrates how often sensitive emails were successfully revoked before being read | Share with management the number of prevented data leaks through successful revocation |
| % of messages sent with Zivver after a rule is triggered | Reports adherence to secure communication policy | Check if sensitive data is sent securely when flagged by Zivver, typically 10–30% | Investigate low numbers; adjust rules or provide additional security training |
| % of messages sent with recommended verification method | Shows adherence to best practice for recipient verification | Verify that SMS, access code, or Zivver account verification is used | Ensure methods comply with policy; analyze recipient security by domain and collaborate with recipient organizations if needed |
| % of Zivver messages opened by recipient | Indicates recipients’ access to secure messages | Confirm that important information is read | If below ~80%, use recipient security dashboards to identify organizations unable to open messages |